MRI Analysis Service

Diffusion MRI
Introduction (Scope of Use/Referring to related papers)
DSI Studio is a software used to analyze Diffusion Spectrum Imaging (DSI) data. DSI is a form of diffusion magnetic resonance imaging (Diffusion MRI), that provides information beyond the standard diffusion tensor to estimate more sophisticated diffusion directions and shapes. DSI Studio supports diffusion tensor tracking and analysis of various diffusion studies. Below are the results published in a journal of international journals using DSI Studio
Analysis Results
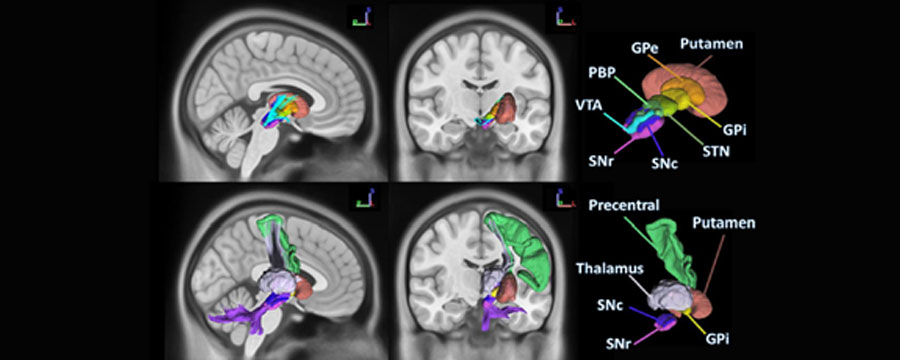
Fig. Basal ganglia segmentation involved in Parkinson’s disease. Left represents segmentations overlaid on top of MNI template, right represents an example segmentation of a PD subject used in this study (Patient 3127), overlaid on the same subject’s T1w image. Structures segmented are left and right putamen, caudate, nucleus accumbens (NA), globus pallidus externus (GPe), globus pallidus internus (GPi), substantia nigra pars compacta (SNc), substantia nigra pars reticula (SNr), subthalamic nucleus (STN), parabrachial pigmented nucleus (PBP), ventral tegmental area (VTA).
Source : https://www.ncbi.nlm.nih.gov/pmc/articles/PMC8572662/
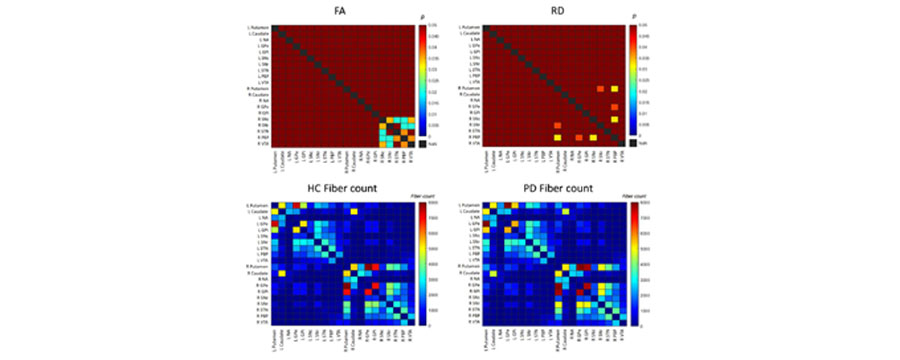
Fig. Connectivity matrices of FDR corrected FA p-values, RD p-values and HC, PD fiber counts. Top two matrices represent FDR corrected p-values of t-test comparisons between HC and PD, with colors closer to red being less significant and colors closer to blue being more significant. Bottom two matrices represent fiber counts between each pair of HC segmentations and each pair of PD segmentations. Colors closer to red represent more numerous fibers and colors closer to blue represent less numerous fibers.
Source : https://www.ncbi.nlm.nih.gov/pmc/articles/PMC8572662/