
Pad effect viewer
Compare brain MRI acquired without and with the pad.
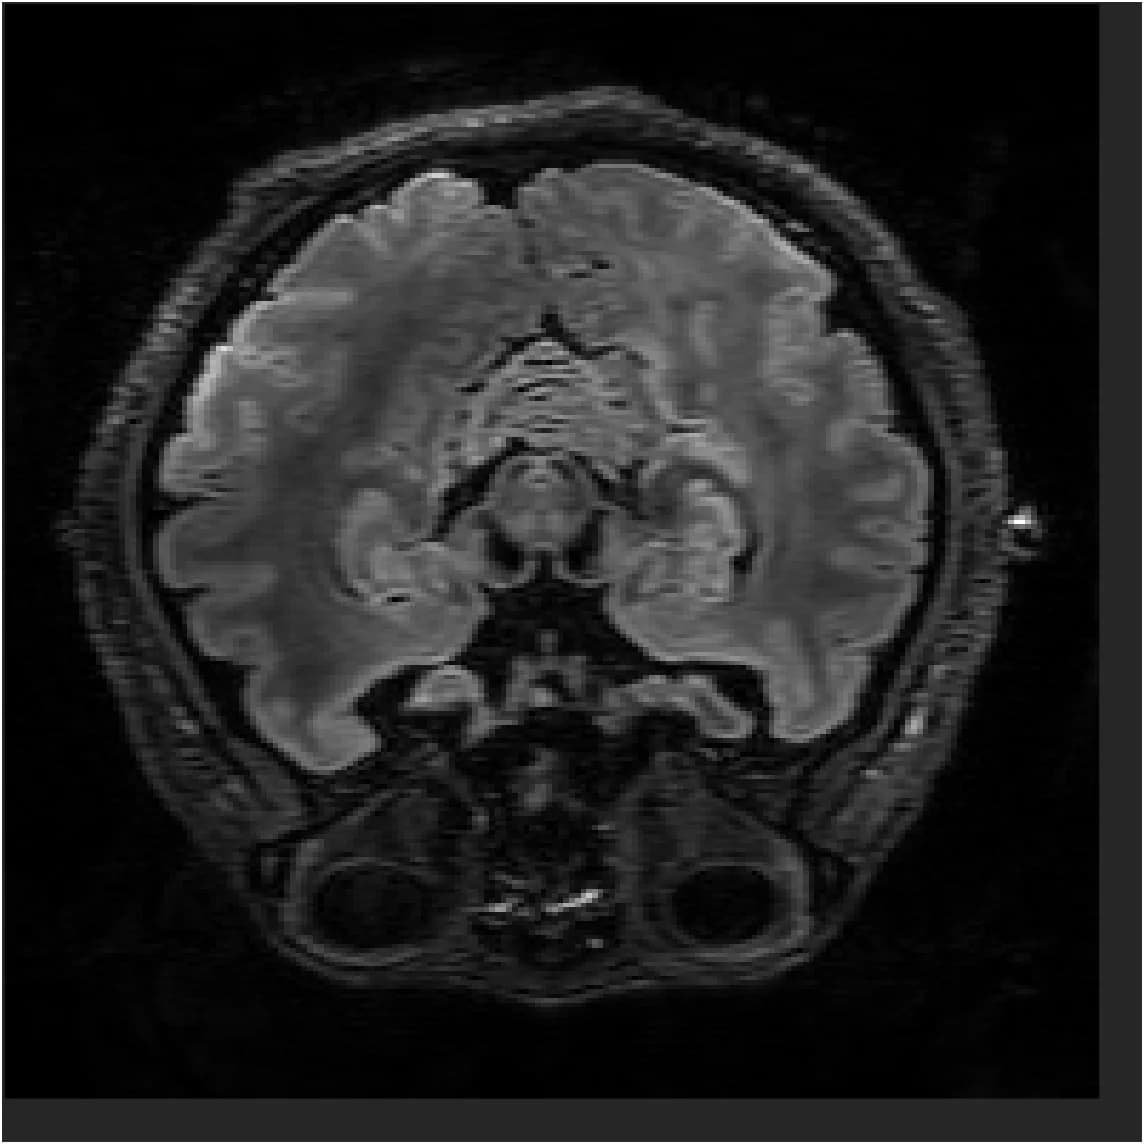
Interactive Demo
Compare brain MRI acquired without and with an MTechLab head pad. Step through T1-weighted and FLAIR images slice by slice, view the map of percentage signal change, and compare the signal-intensity histograms.
Mechanism
How a high-permittivity pad improves the signal
High-permittivity medium
Flexible inserts of a barium-titanate-based medium with high relative permittivity lie between the RF coil and the anatomy.
Local redistribution of the B₁⁺ field
Displacement currents induced in the medium generate a secondary RF magnetic field. It strengthens the local B₁⁺ field where signal loss and shading would otherwise appear.
Signal intensity ratio
The viewer reports the signal intensity ratio, SIR = mean signal with the pad ÷ mean signal without it, for each slice and for the whole volume. A value above 1.0 means higher mean signal with the pad.
Explore further
Publications, pads and analysis software
Published studies
Peer-reviewed 7T studies of the MTechLab head pad.
Learn moreMRI high-permittivity pads
Eleven anatomy-specific pads, each with three auxiliary pads, for MRI systems from 1.5T to 7T.
Learn moreAI MRI analysis
AI software for denoising, brain segmentation and quantitative analysis.
Learn moreEvaluate a pad on your own scanner.
Request an evaluation for your field strength and anatomy.