
Skip to content

BrainDS · Structural MRI

The analysis core that turns structural MRI into numbers.

BrainDS segments 95 brain regions from a standard 3D T1-weighted scan, compares every regional volume with healthy adults of the same age and sex, and brings the results together in a structured report — on a workstation inside your own network.

Research use only: Available now for research use only. Not yet approved as a medical device by MFDS (KFDA), the FDA or CE — not for clinical or diagnostic use.

  • 3D T1-weighted MRI
  • DICOM
  • 95 brain regions
  • Age- and sex-matched percentiles
  • English · Korean
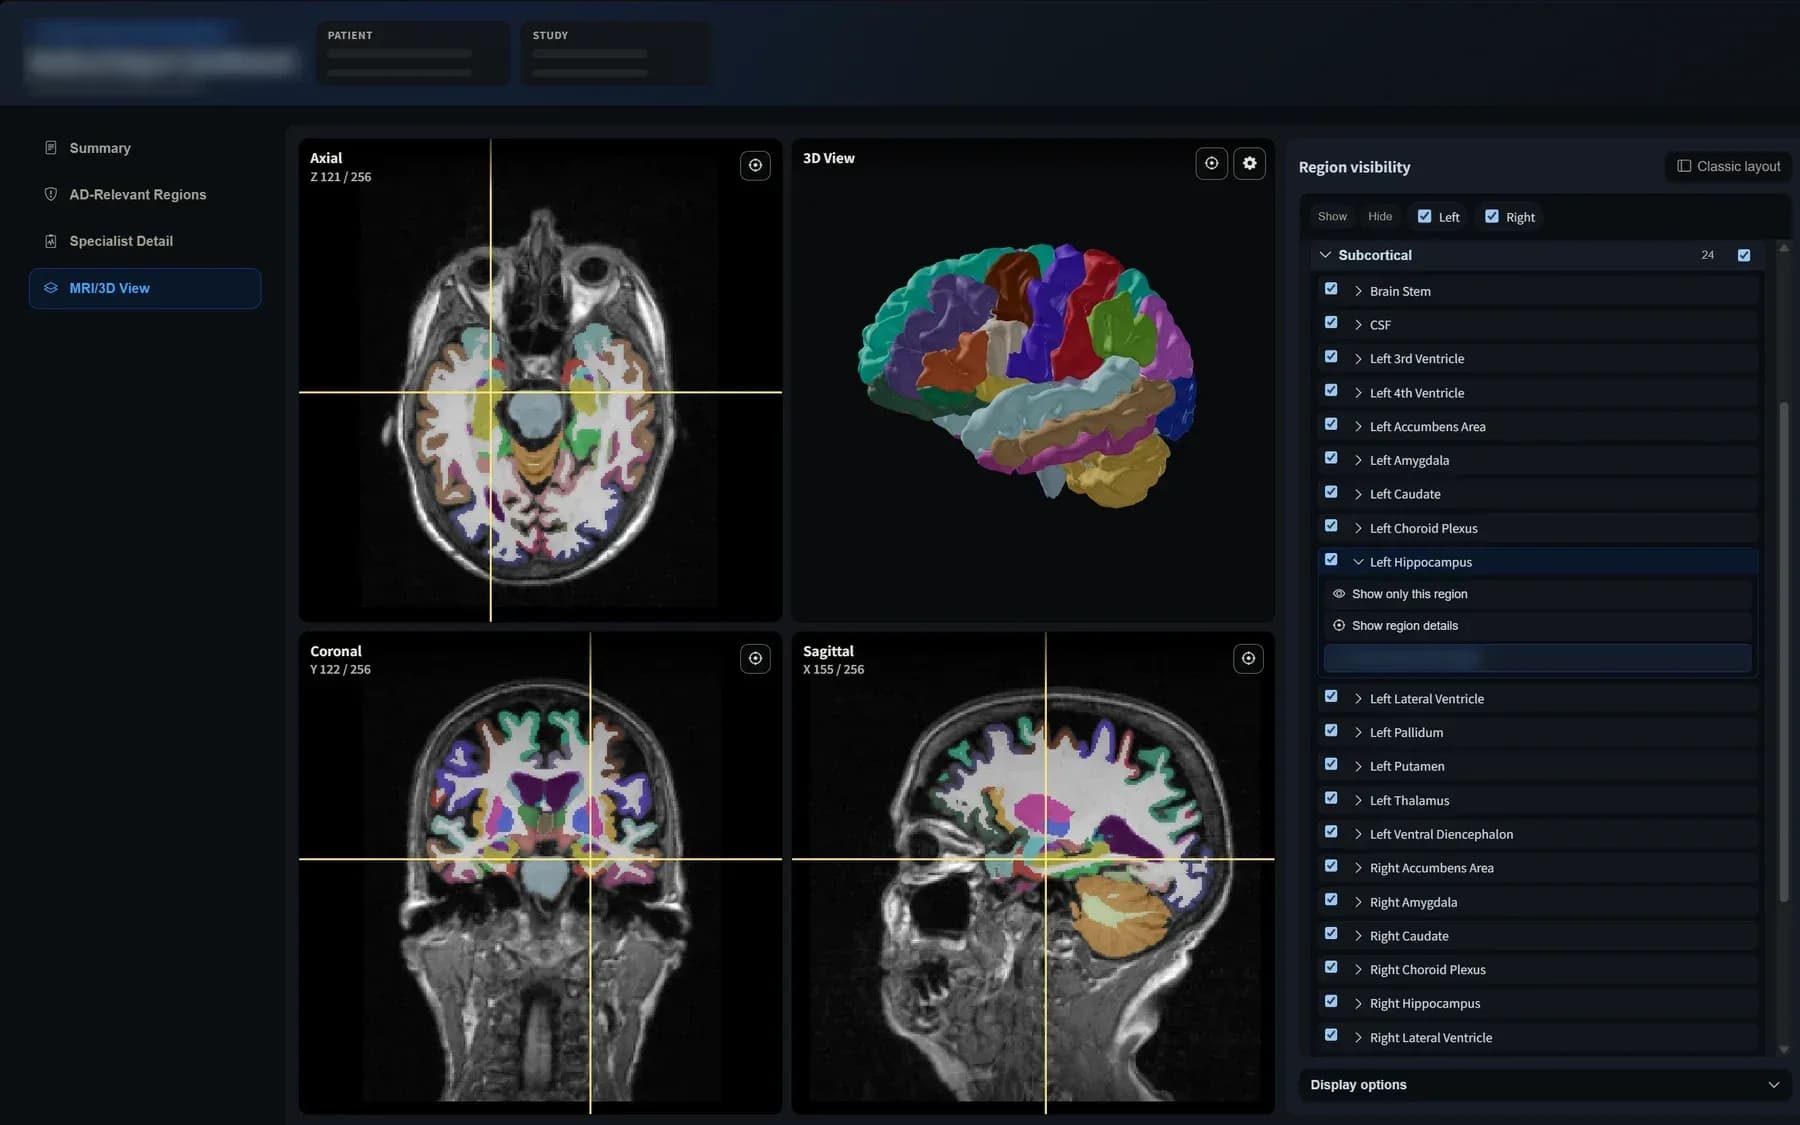
BrainDS MRI/3D view with a colour-coded brain segmentation in axial, coronal, sagittal and 3D panels, with patient details masked
BrainDS structural report summary page with segmentation thumbnails, whole-brain volumes and a percentile radar, with patient details masked
Fig. 01BrainDS MRI/3D view with the structural report summary page. Sample case from public research data (ADNI); personal details masked.
  • 951

    brain regions segmented and measured in every scan

    DKT atlas — 90 paired and 5 unpaired structures

  • 1,8331

    healthy adults aged 21–90 in the published normative study

    Korean, IXI and ADNI cohorts

  • 0.99651

    mean ICC agreement with FreeSurfer 7.4 in the published study

    Lobe-level volumes, 60-subject validation subset

  • 14

    pages in the structured report, in English or Korean

    Whole-brain summary to region-level detail

01 / Workflow

From DICOM to report in four steps

Every step runs locally, on the same study, without sending images outside your network.

  1. 01

    Import

    Upload DICOM files, folders or ZIP archives, or send studies from the scanner or PACS over the DICOM network to a local study store. Studies can be anonymised, and access is controlled by role.

  2. 02

    Segment

    A deep-learning pipeline built on FastSurfer resamples the 3D T1-weighted series to 1 mm and segments 95 cortical and subcortical regions of the DKT atlas.1

  3. 03

    Compare

    Regional volumes are adjusted for head size and compared with healthy adults of the same sex and similar age, then expressed as percentiles with left–right asymmetry flagged.

  4. 04

    Report

    Results appear in an interactive dashboard and a structured PDF report in English or Korean, with 3D views and longitudinal comparison when earlier scans exist.

02 / Capabilities

What BrainDS shows your team

One dashboard for review, one report for the record — both built on the same measurements.

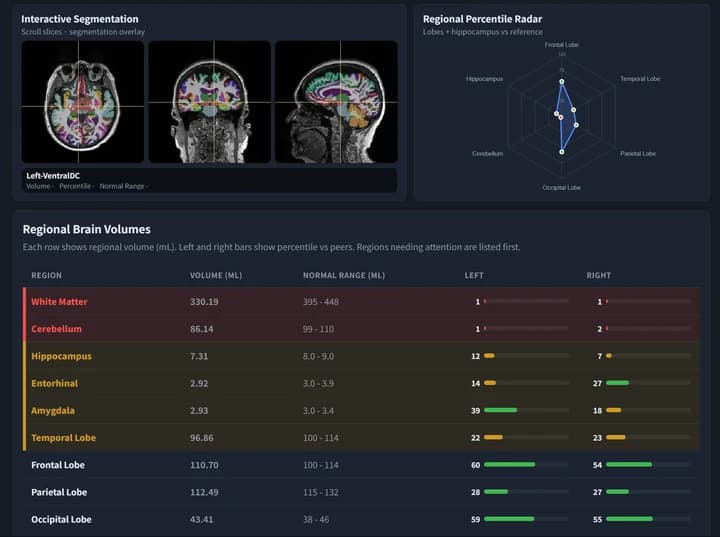
BrainDS dashboard with segmentation overlays in three planes, a regional percentile radar and a table of regional brain volumes with left and right percentiles
Fig. 02BrainDS dashboard — segmentation review, percentile radar and regional volumes. Public research data (ADNI).

Every region, measured and placed in context

Regional volumes in millilitres sit beside the normal range of matched healthy adults, with left and right percentiles side by side. Regions outside the reference range are listed first, so review starts where it matters.

  • Volume, normal range and percentile for each region
  • Left and right hemispheres reported separately
  • Percentile radar and segmentation review in three planes
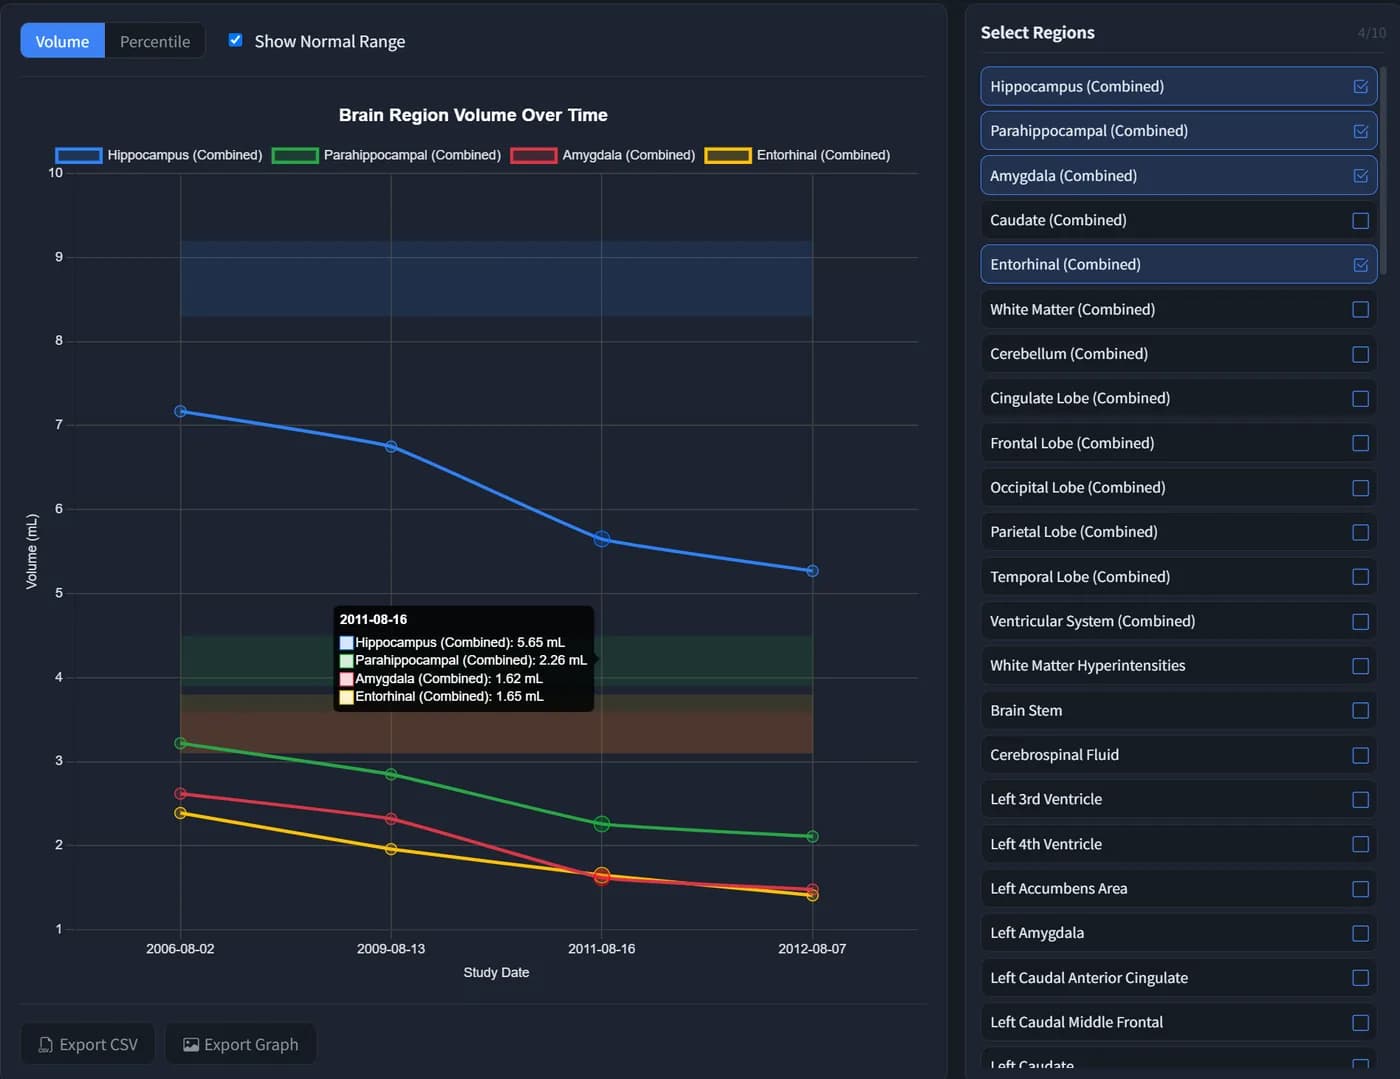
BrainDS longitudinal chart of hippocampal, parahippocampal, amygdala and entorhinal volumes across four study dates
Fig. 03Longitudinal view — regional volumes across visits with the normal range shaded. Public research data (ADNI).

Follow change over time

When a patient has earlier scans, BrainDS charts regional volume or percentile across visits against the normal range. Charts and tables export for your own analysis, and research cohorts can be queued for batch processing.

  • Longitudinal volume and percentile charts
  • CSV and PNG export
  • Batch processing for research cohorts
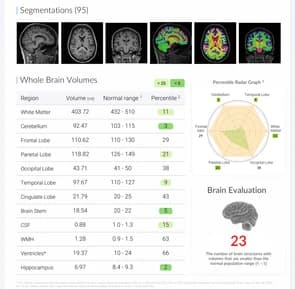
Summary page of the BrainDS structural report with segmentation thumbnails, a whole-brain volume table and a percentile radar
Fig. 04Structural report, summary page (excerpt). Identifiers removed; public research data (ADNI).

A structured report your team can read

The 14-page PDF opens with whole-brain and regional volumes, a percentile radar and grouped region reviews, with plain-language cards that explain what each key structure does.

  • English or Korean PDF
  • Grouped reviews, including regions relevant to Alzheimer’s disease
  • Plain-language explanation for key structures

Inspect every structure in 2D and 3D

Axial, coronal and sagittal views share one crosshair and a segmentation overlay beside an interactive 3D model. Regions can be shown or hidden by lobe or structure.

  • Tri-planar MRI with segmentation overlay
  • Interactive 3D region model
  • Volume, percentile and normal range for the selected region
03 / Reference population

A normative reference that includes Korean adults

A percentile is only as meaningful as the population behind it. The normative study behind BrainDS brings together cognitively healthy adults from three cohorts — including a Korean cohort scanned at Gachon University — to describe regional volume across adulthood.

1,83314

cognitively healthy adults, aged 21–90

Korean cohortGachon University · 3T
361
IXIPublic research dataset
563
ADNIPublic research dataset
909

Figures describe the published study population, which also served as the reference in a 2026 follow-up study. In BrainDS, each scan is compared with participants of the same sex and similar age.

04 / Acquisition

Better input, better numbers

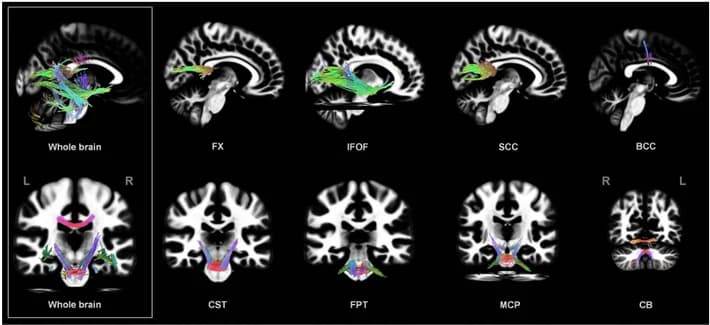
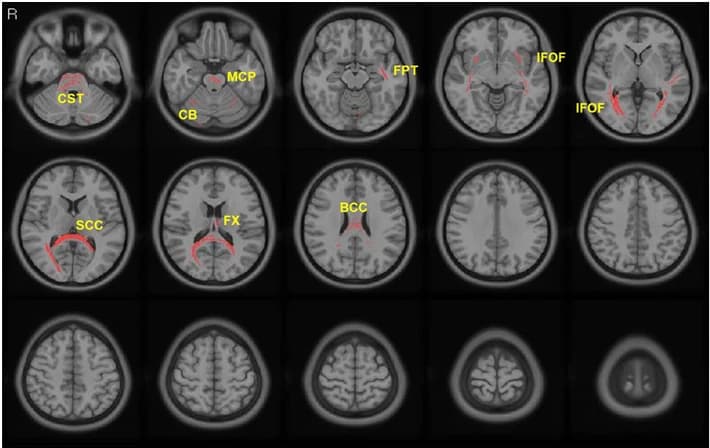
Quantification starts at acquisition. In two 7T studies, MTechLab’s high-permittivity dielectric pad raised signal where it matters for brain analysis: diffusion signal (quantitative anisotropy) increased by about 20% overall across major white-matter tracts in six volunteers, and T1-weighted SNR rose by 24.7% while segmentation-derived cerebellar volumes stayed unchanged in four.23

Axial MRI slices with red overlays marking white-matter tracts where diffusion signal increased with the dielectric pad
Fig. 05Tracts with increased quantitative anisotropy with the pad at 7T. Park et al., 2023, Fig. 3 (CC BY 4.0), cropped.
Three-dimensional tractography of the fibre tracts whose signal increased when the dielectric pad was used
Fig. 06Tractography of the tracts with increased signal. Park et al., 2023, Fig. 4 (CC BY 4.0), cropped.
05 / Specifications

Specifications

Input
3D T1-weighted brain MRI (e.g. MPRAGE), DICOM
Segmentation
Deep learning, FastSurfer-based · DKT atlas, 95 regions
Comparison
Head-size adjusted · same-sex, similar-age healthy adults
Outputs
Dashboard · 3D view · 14-page PDF · CSV/PNG export
Longitudinal
Regional volume and percentile across visits
Deployment
On-premise GPU workstation with a local DICOM store
Security
Role-based accounts · idle logout · encrypted connections · audit log
Languages
English, Korean
Status
Available now · research use only · not yet approved as a medical device
07 / FAQ

FAQ

What data does BrainDS need?

A 3D T1-weighted brain MRI series in DICOM format, such as an MPRAGE acquisition. Age and sex are read from the DICOM header to select the matched reference group.

Do images leave our network?

No. BrainDS runs on-premise: studies are stored and processed on a workstation inside your network, and no cloud service is involved.

Is BrainDS approved for clinical use?

No. BrainDS is available for research use only. It has not yet been approved as a medical device by MFDS (KFDA), the FDA or CE.

How is the normal range defined?

Each volume is compared with healthy adults of the same sex and similar age after adjusting for head size. The report shows the percentile position and the normal range of that matched group.

Which languages are supported?

The interface and the report are available in English and Korean.

Can BrainDS be extended to other modalities?

Yes. BrainDS + PET adds regional PET quantification on the same segmentation, and BrainDS + fMRI — a research module in development — will extend the suite to functional connectivity.

See what BrainDS can show your team

Arrange a demonstration, or talk to us about a joint research project.