FDG
Glucose metabolism
- Composite SUVR over Alzheimer’s-relevant regions
- Z-score and % difference versus reference data
- Lobe-level cortical summary
BrainDS + PET · Signal
Optional module · Research use only
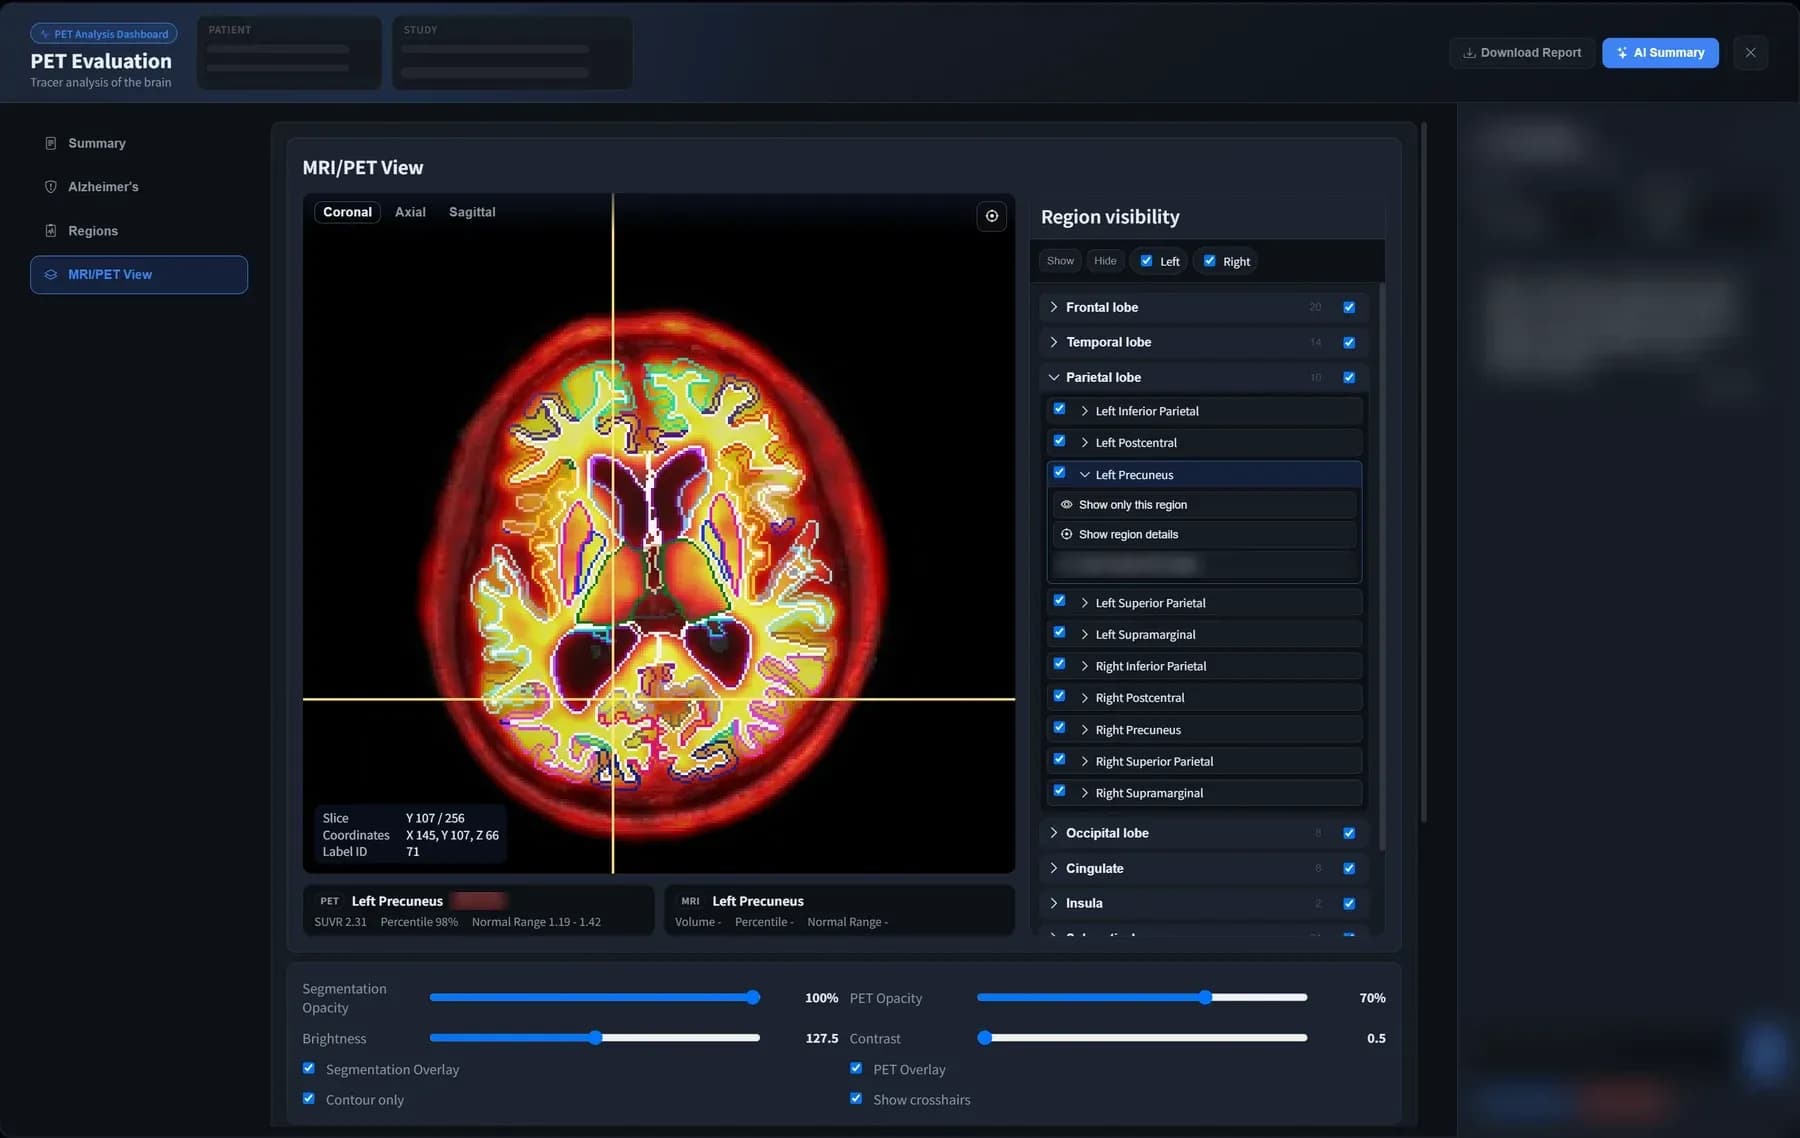
BrainDS + PET is an optional BrainDS module. It aligns brain PET to the same patient’s T1-weighted MRI, measures uptake region by region as SUVR, and compares it with reference data for each tracer — so structure and signal are reviewed together.
BrainDS + PET viewer (amyloid PET) with an FDG report summary page. Sample cases from public research data (ADNI); personal details masked and automated interpretation text blurred.
Optional module · Research use onlyAvailable now for research use only. Not yet approved as a medical device by MFDS (KFDA), the FDA or CE — not for clinical or diagnostic use.
Structural MRI and PET answer different questions. Measuring both on one segmentation ties every PET value to a named region of the same brain.
MRI · Structure
Structural MRI measures the size and shape of brain regions — the basis of BrainDS volumetry.
PET · Signal
PET images a radiotracer, showing processes such as glucose metabolism or protein deposition that may change before structural loss is visible.
BrainDS + PET
PET is sampled inside the regions of the patient’s own BrainDS segmentation, so structure and signal can be read region by region.
PET analysis reuses the BrainDS segmentation of the same patient.
01
Select a brain PET study and a matching 3D T1-weighted MRI of the same patient. The tracer is recognised from the DICOM metadata.
02
BrainDS segments the T1 scan into its 95 regions — the same map used for structural analysis.1
03
The PET volume is registered to the patient’s own T1 scan, and a check image confirms the alignment.
04
Regional and composite SUVR are calculated with the cerebellar cortex as the reference region, then compared with reference data for the tracer as Z-scores, percentiles and percentage differences.
05
An eight-page PET report in English or Korean, with fused PET–MRI views and longitudinal trends when earlier PET studies exist.
Each tracer gets its own summary measures and its own reference data.
Glucose metabolism
Amyloid deposition
Tau deposition
Tracer support is confirmed for each research project.
The same study list, viewer and report format as BrainDS.
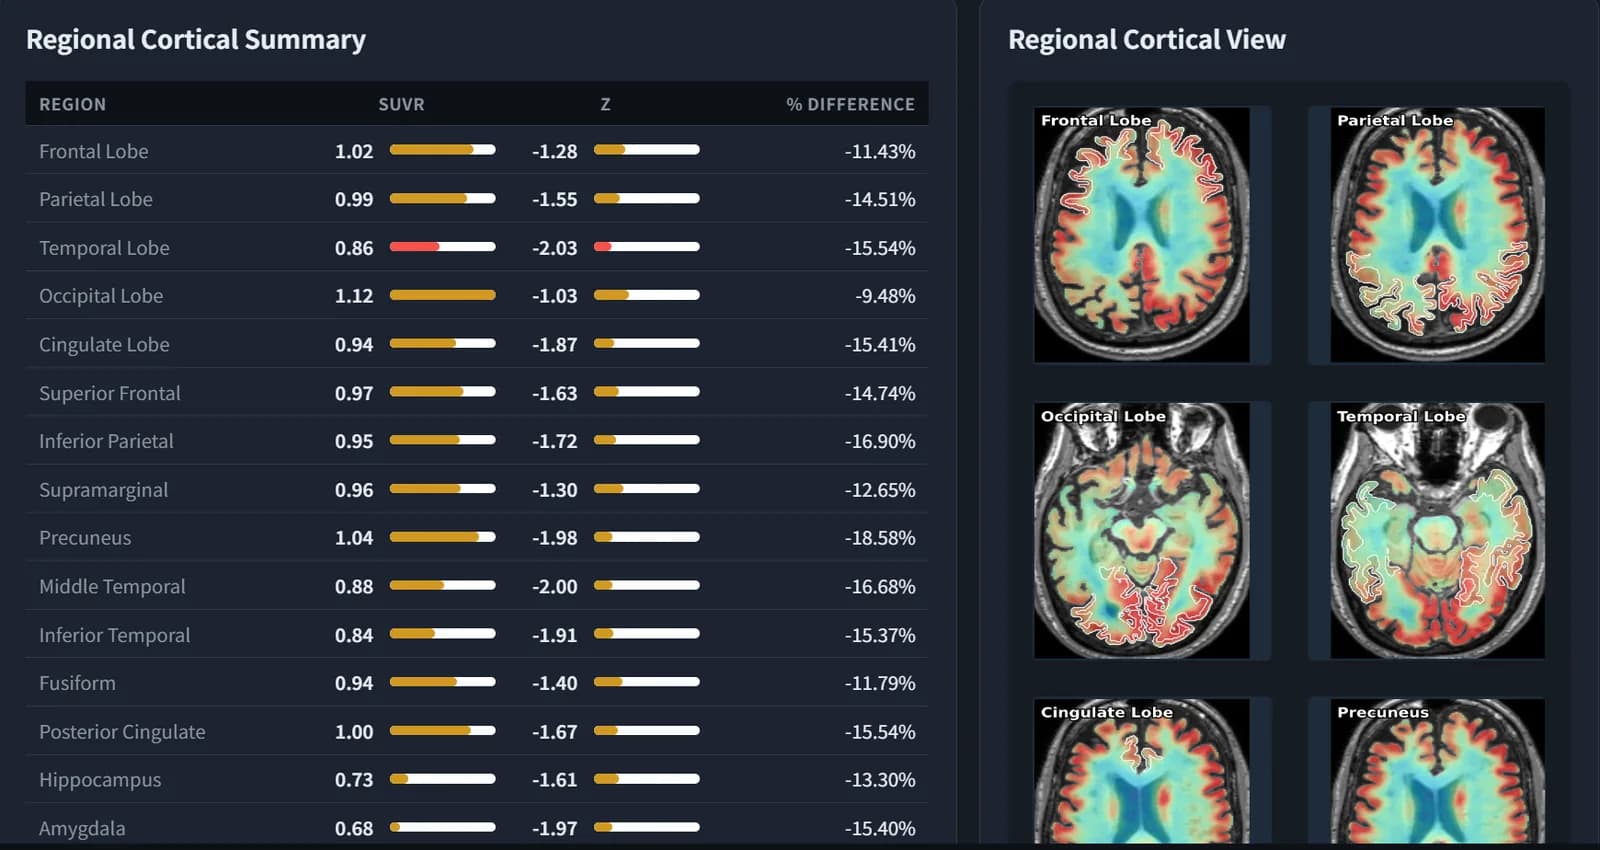
Each study is summarised by region — SUVR, Z-score and percentage difference — beside colour-mapped cortical views, with full left–right tables behind it.
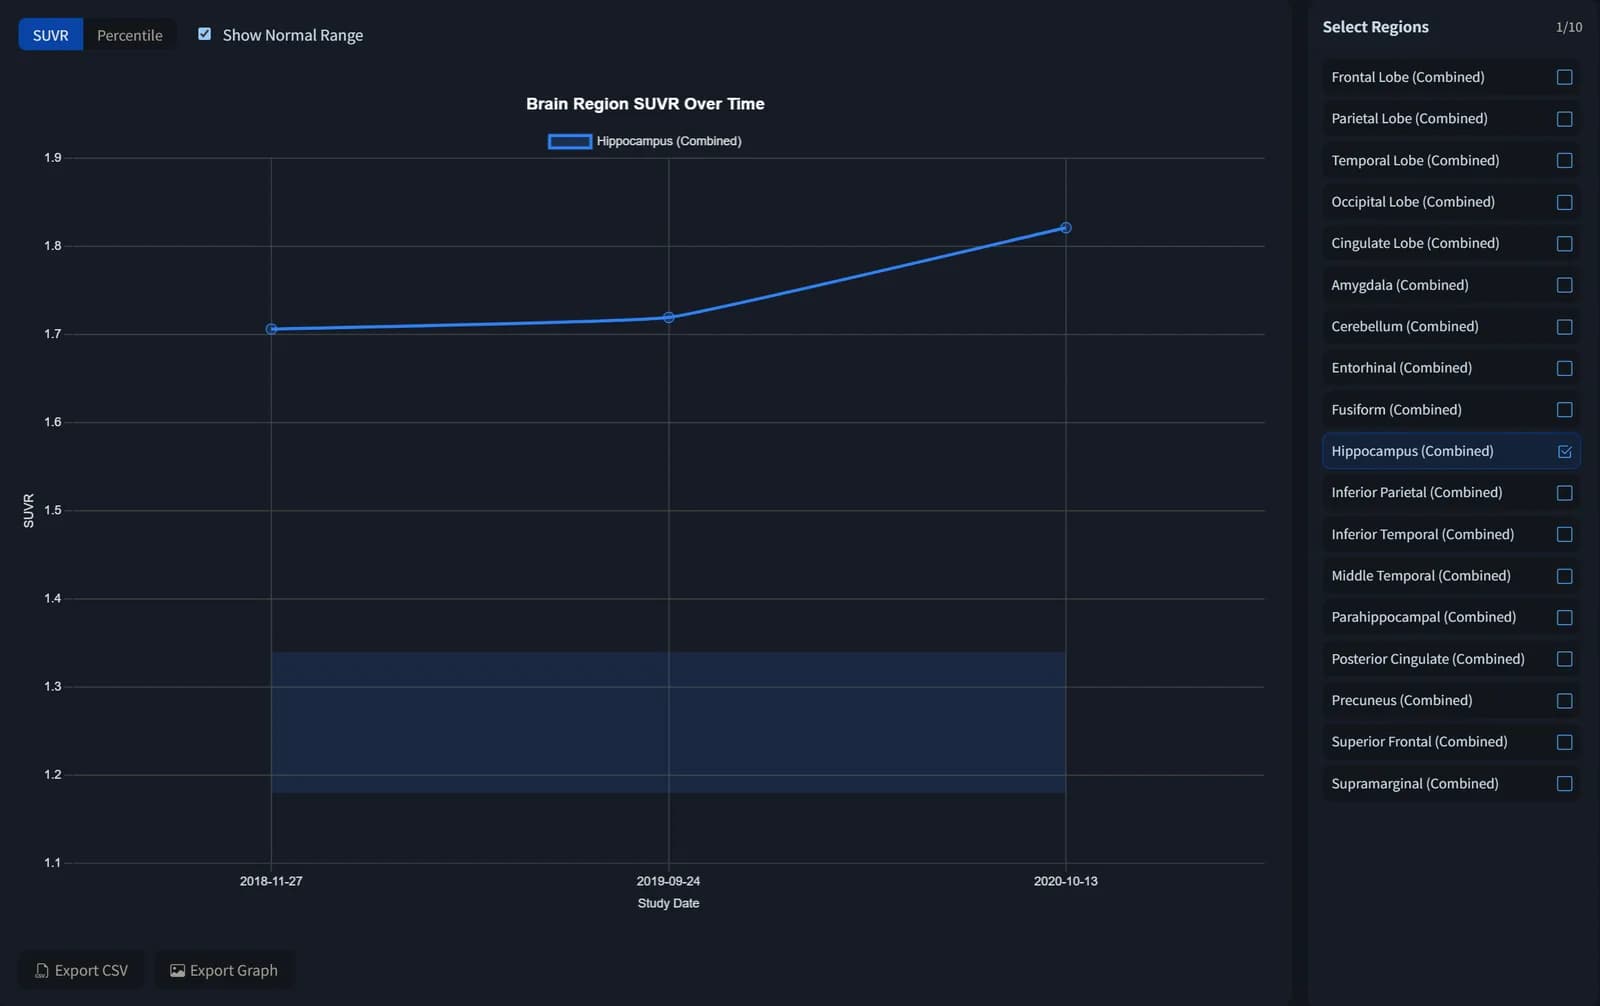
When earlier PET studies exist, BrainDS + PET charts regional SUVR or percentile across visits against the reference band.
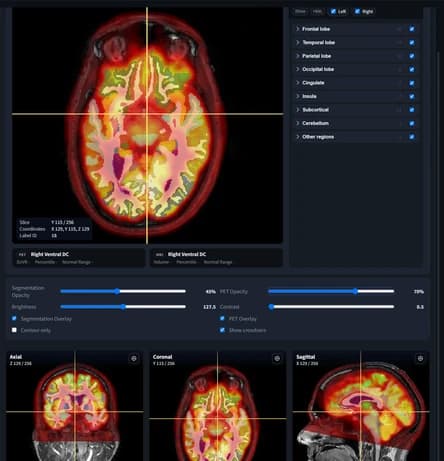
Review PET over the patient’s MRI in three planes. Adjust PET and segmentation opacity, brightness and contrast, or switch to contours only.
PET runs inside the same on-premise BrainDS installation — no separate platform to deploy, secure or learn.
Sample pages from the eight-page PET report: tracer summaries, regional PET intensity maps with SUVR tables, and a plain-language region guide.
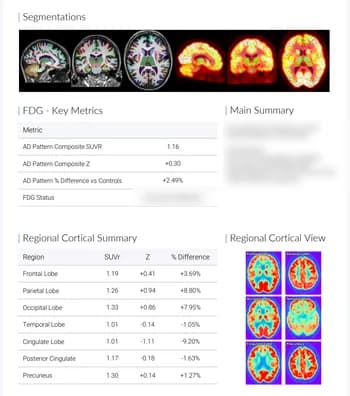
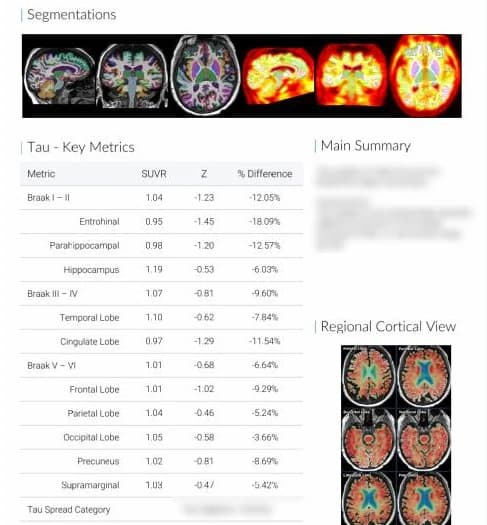
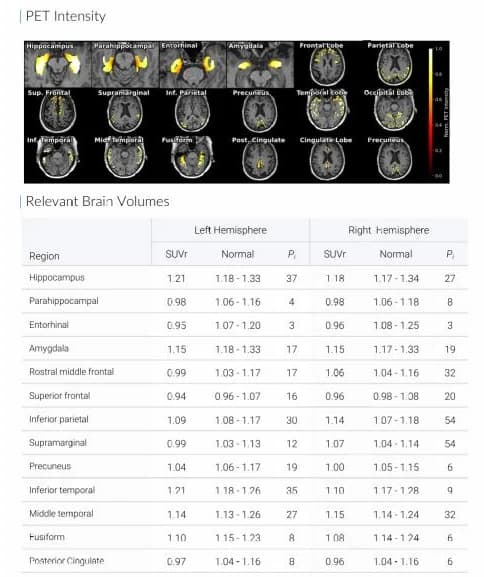
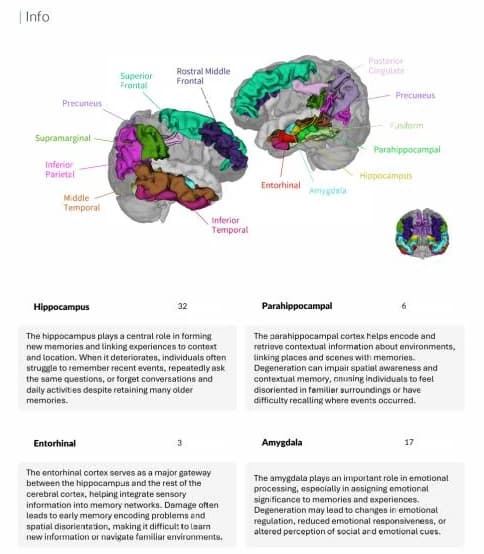
Sample pages from public research data (ADNI). Identifiers are removed and automated interpretation text is blurred.
Studies by researchers at MTechLab and Gachon University. Results describe the cohorts studied; they are not claims about BrainDS product performance.
BrainDS + PET recognises FDG, amyloid (florbetapir) and tau (flortaucipir) PET from the DICOM metadata. Tracer support is confirmed for each research project.
PET is aligned to the patient’s own T1 scan so that uptake is measured inside regions defined by the BrainDS segmentation of that same brain.
The cerebellar cortex of both hemispheres.
No. It is an optional module that runs inside a BrainDS installation and shares its study list, viewer and report format.
No. BrainDS + PET is available for research use only. It has not yet been approved as a medical device by MFDS (KFDA), the FDA or CE.
Talk to us about BrainDS + PET for your nuclear-medicine or research imaging team.